Understanding Bitcoin Candlestick Charts: A Beginner’s Guide
Bitcoin trading has gained immense popularity, and one effective method that traders use to navigate the market is the candlestick chart. This charting technique simplifies the perception of price movements and market trends, making it ideal for traders of all levels, especially beginners.
What are Candlestick Charts?
Candlestick charts not only showcase price activity but also encapsulate market sentiment, indicating bullish or bearish tendencies. Developed in Japan by the rice trader Honma Munehisa in the 18th century, this technique was adapted into Western financial markets in the late 1980s. Over the decades, it has become a fundamental component of technical analysis in Bitcoin trading.
These charts display crucial price action over specific periods, helping traders make informed decisions about when to enter or exit a trade. By representing the opening, closing, highest, and lowest prices, traders can quickly analyze market behavior.
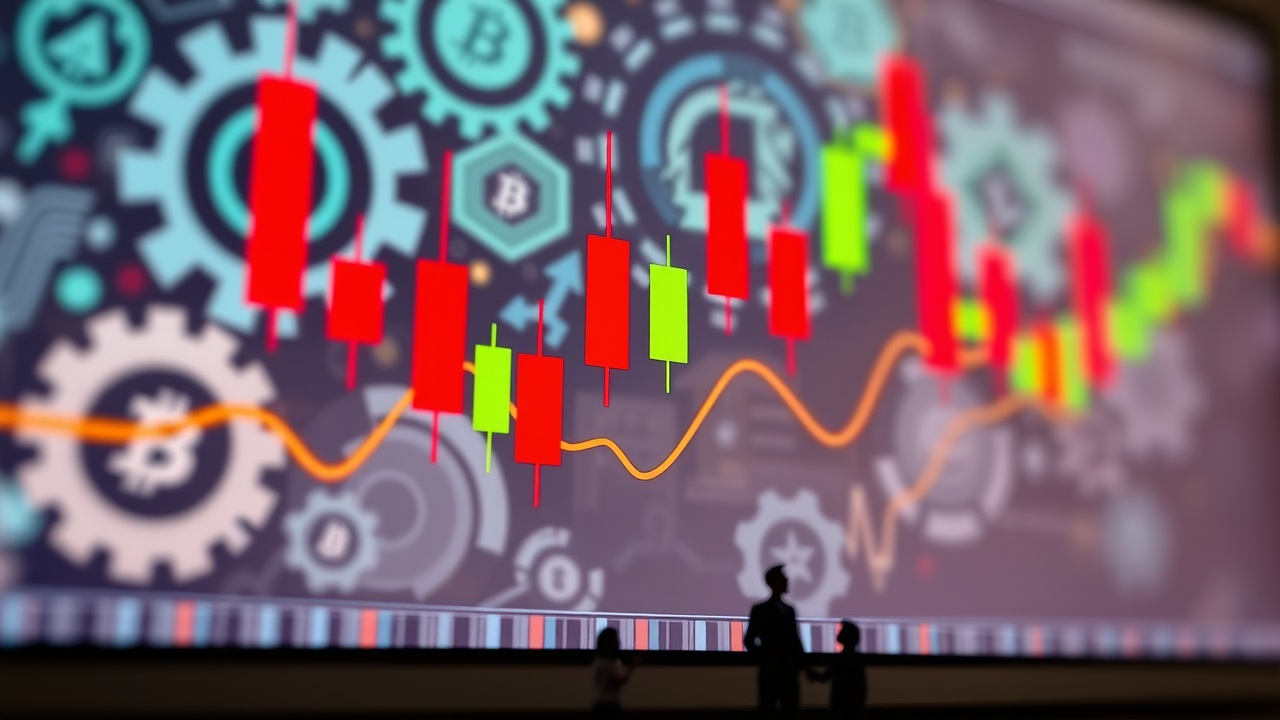
Understanding Candlestick Components
Each candlestick consists of a body, which is either green (indicating a price increase) or red (indicating a price decrease), along with wicks that depict the price extremes during that time frame.
For example, if Bitcoin opens at $90,000 and closes at $93,500 within a four-hour period while hitting a high of $95,000 and a low of $88,700, the resulting candlestick would illustrate these movements with a green body and respective wicks.
This visual representation allows traders to grasp market trends swiftly, informing their strategies.
Enhancing Your Trading Strategy
Although candlestick charts provide valuable insights, beginners should not rely solely on them for trading decisions. Diversifying one’s analysis with other technical indicators, such as moving averages (MAs) and the relative strength index (RSI), enhances the robustness of the trading strategy. For instance, MAs can indicate general price trends, while the RSI evaluates the strength of price movements.
To further improve trading strategies, traders may explore advanced techniques such as Fibonacci retracements, which help identify potential support and resistance levels, or the volume profile, which highlights trading volume relative to price. Understanding these tools can offer deeper insights into market psychology and help foresee price movements.
Risk Management in Trading
While utilizing candlesticks and other analysis methods can provide clarity, traders must remember that market conditions are inherently risky. It is critical to incorporate effective risk management practices and to trade with caution, ensuring not to invest more than one can afford to lose.
Arming oneself with knowledge and forming a comprehensive toolkit of analytical tools will significantly enhance one’s trading prowess in the dynamic cryptocurrency landscape.