Navigating the Cryptocurrency Trading Landscape
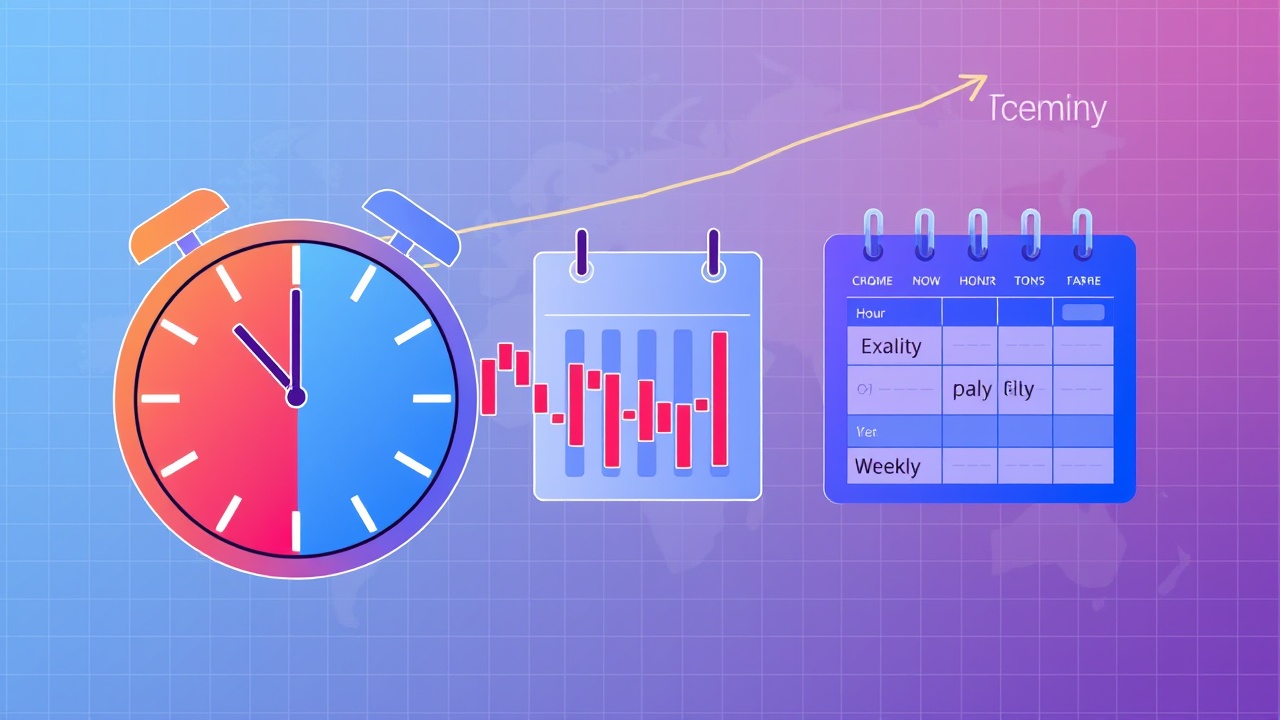
Navigating the dynamic landscape of cryptocurrency trading requires an understanding of how various timeframes can influence market analysis. Investors and developers across the globe rely on crypto charts to identify trends in leading assets like Bitcoin and Ethereum. Utilizing different timeframes provides valuable insights into market movements: whether looking at the short-term fluctuations of an hourly chart, or assessing long-term trends with weekly views, each perspective contributes essential context to trading strategies.
Short-Term Analysis with Hourly Charts
The hourly chart, favored for its focus on immediate market sentiment, allows traders to detect rapid price changes and shifts in liquidity that may go unnoticed in more extended analyses. It serves as a tool for real-time updates, particularly beneficial during significant events like product launches or major announcements. However, reliance on short-term data can mislead participants, amplifying market noise and creating potential for rash decisions. To counteract this, integrating hourly data with longer-term charts can offer critical confirmation of trends.
Mid-Term Insights from Daily Charts
In contrast, daily charts serve as a sweet spot for mid-term analysis, presenting a clearer picture of investor sentiment by smoothing out the day-to-day volatility. These charts can indicate accumulation or distribution phases effectively, making them suitable for tracking market movements across different time zones and aligning trading strategies with institutional goals. Their balanced readability not only aids investors but also enhances the communicative potential of data for analysts and educators alike.
Long-Term Perspectives with Weekly Charts
On a broader scale, weekly charts provide an overarching view of market behaviors, allowing individuals to track significant shifts in crypto adoption, regulatory impacts, or broader structural changes within the ecosystem. Weekly data simplifies the landscape by filtering out noise from short-term trends and is instrumental in confirming signals identified in daily analyses. By illustrating cyclical patterns of growth and decline, they help forecast broader market sentiments and long-term positions.
Choosing the Right Timeframe
Selecting the appropriate timeframe is crucial as it aligns with one’s trading objectives and risk tolerance. Short-term traders might gravitate towards hourly charts to capture fleeting opportunities, while those concentrating on strategic investments may prefer weekly charts, despite their slower responsiveness to rapid changes. As the crypto market evolves, understanding the implications of these timeframes becomes essential.
Conclusion
Effective use of these analytical tools provides clarity in the fast-paced crypto world, where every change can have significant implications. While timeframes do not dictate actions, they furnish investors with distinct viewpoints. Ultimately, mastering the art of reading charts within varying timeframes can enable better comprehension of market behavior, allowing participants to adapt their strategies to the shifting tides of cryptocurrency markets.